It’s Not About Service Availability
Industry talks service availability which isn’t very useful from a business perspective. There is a better way.

Service availability is the measure of time that services are available during a given window, usually specified in either months or years. It is generally defined in the number of nines, either as 99.999% or five nines. But in my experience, most people intuitively have no idea what this means. So if you’re a system architect and receive this requirement from product management, what do you think?
What I think is… here we go again.
And honestly, I think we focus on the opposite of what we should. Why are we concerned with availability? Instead, we should concentrate on unavailability/downtime. Let me explain.
Note: All calculations in this post assume a 30.416-day month, 365 days / 12 months. Also, I round the times to the nearest minute unless seconds are specified. Check out uptime and downtime if you want to translate down to the millisecond.
AWS S3 Service Level Agreement
Let’s start with AWS S3 availability because they back their numbers up with a refund policy, so they must be serious. For details, check out their Service Level Agreement (SLA).
| Monthly Uptime Percentage | Service Credit |
|---|---|
| 98% ≤ Service < 99% | 10% |
| 95% ≤ Service < 98% | 25% |
| Service < 95% | 100% |
But what do these percentages actually mean? First, let’s put this into an understandable form – time.
- If service is only up between 42,953 and 43,391 minutes in a month, you receive a 10% refund.
- If it is up between 41,638 and 42,953 minutes a month, you receive a 25% refund.
- If it is up less than 41,638 minutes in a month, you receive a 100% refund.
Wow, that’s a lot of minutes! I bet more people know that there are 525,600 minutes in a year than what these minutes mean. You do know the song, right?
But the truth of the matter is, do you really care about how much a service is up? Isn’t it more important to know the potential downtime?
So let’s look at it from a different angle and see what you think.
- If the service is down between 7h 18m and 14h 27m in a month, you receive a 10% refund.
- If the service is down between 14h 27m and 1d 12h 31m in a month, you receive a 25% refund.
- If it is down more than 1d 12h 31m in a month, you receive a 100% refund.
| Daily | Monthly | Yearly | |
|---|---|---|---|
| 95.0% | 1h 12m | 1d 12h 31m | 18d 6h 17m |
| 99.0% | 14m | 7h 18m | 3d 15h 39m |
| 99.9% | 1m | 44m | 8h 46m |
| 99.99% | 8.6s | 4m | 53m |
| 99.999% | 0.9s | 26.3s | 5m 15.6s |
| 99.9999% | 0.1s | 2.6s | 31.6s |
| 99.99999% | 0.0s | 0.3s | 3.2s |

Finally, a concept that we can understand. If 44 minutes of monthly downtime creates panic, STOP!!! Because this is manageable.
Ask yourself:
- “What happens if your application goes down for an hour?”
- “Will you lose customers? Do you lose revenue, and if so, how much?”
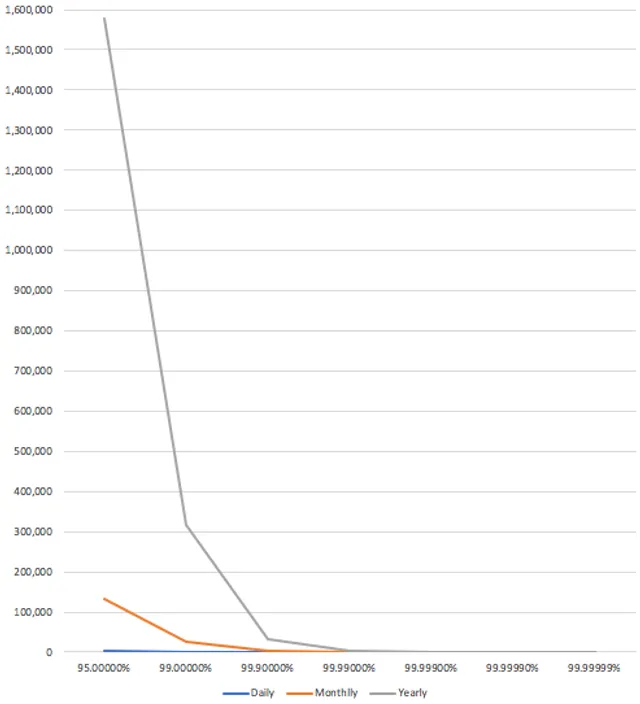
Now, let’s look at how quickly these times drop off. I graphed this in seconds to show how going from 95% to 99.9% makes an enormous difference. As you approach 99.99%, not so much.
Understanding the Nines
Availability is the wrong way to think about it. Unavailability is what we really care about and can understand. And, the best part is that you can design for unavailability.
Let’s go over what each level of nine means in terms of unavailability using the monthly average. In each case, I assume one outage per month. If you regularly have more than that, then you have bigger problems to worry about.
- 95% – 1.5 days: If you cannot recover the service in this amount of time, you have human issues. And if you are cloud-based and cannot recover, we need to have a serious talk.
- 99% – 7 hours 18 minutes: You have almost a full working day, which should be easily achievable.
- 99.9% – 44 minutes: Now, the recovery starts to get interesting. Almost everything should be automated except for a couple of manual steps. If you have any manual steps, I assume you have a 24x7 operations center.
- 99.99% – 4 minutes: This requires, at a minimum, fully redundant systems with near real-time replication of data and automated failover.
- 99.999% – 26.3 seconds: This is the “gold” standard of five nines. At this point, you must do everything in a fault-tolerant architecture so that failures are designed into the system. Also, if you are a web application using global DNS load balancers, you cannot guarantee 99.999% of services because the minimum timeout of a DNS entry is 60 seconds. That’s over double your 26.3 seconds.
For me, there is virtually no difference in creating a system architecture for anything at 99.99% or above. However, if you absolutely require four nines or higher service availability and cannot meet it, you probably have a significant design or automation issue.
Now I challenge you. Start asking people at your company one of the following questions to gauge their response:
- “What happens if our service goes down for an hour?”
- “What happens if we don’t hit 99.9% availability?”
You will see the difference.